Data Science Interview Questions For Freshers 2025

If you want Data Science Interview Questions For Freshers And Experts as PDF Click the download button
1. What is Data Science?
Answer: Data Science is a field that combines statistical methods, algorithms, data analysis, and machine learning to extract insights and knowledge from data.
2. What is the difference between supervised and unsupervised learning?
Answer: Supervised learning uses labeled data to predict outcomes, while unsupervised learning finds patterns or groups in unlabeled data.
3. What are the main steps in a Data Science project?
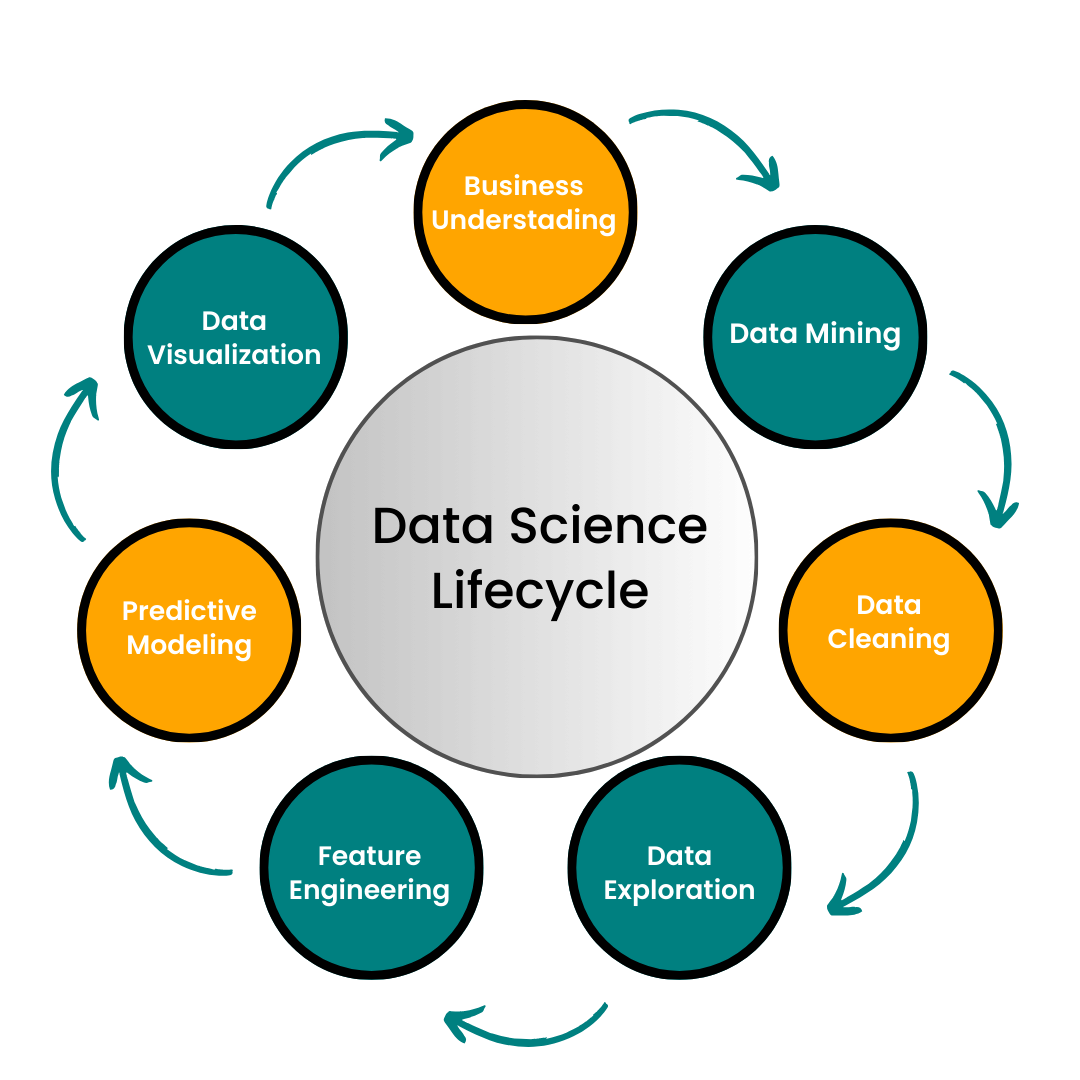
Answer: Define the problem, collect data, clean data, analyze data, build models, evaluate models, and interpret results.
4. What is overfitting?
Answer: Overfitting occurs when a model learns the noise in the training data instead of the actual pattern, making it perform poorly on new data.
5. What is underfitting?
Answer: Underfitting happens when a model is too simple to capture the underlying pattern in the data, leading to poor performance on both training and test data.
6. What is bias-variance tradeoff?
Answer: It’s a balance between a model’s accuracy and its ability to generalize. Low bias can lead to high variance (overfitting), and low variance can lead to high bias (underfitting).
7. Explain cross-validation.
Answer: Cross-validation is a technique to assess model performance by splitting data into multiple training and testing sets, then averaging the results.
8. What is regularization?
Answer: Regularization is a technique used to reduce overfitting by adding a penalty to model complexity in regression and neural networks.
9. What is multicollinearity?
Answer: Multicollinearity occurs when two or more predictor variables in a model are highly correlated, which can make it difficult to determine their individual effects.
10. Explain logistic regression.
Answer: Logistic regression is a supervised classification algorithm used to predict binary outcomes by calculating the probability of a target variable.
11. What is a p-value?
Answer: A p-value is the probability that the observed data would occur if the null hypothesis were true. A low p-value indicates that the null hypothesis can be rejected.
12. What is A/B testing?
Answer: A/B testing is an experiment where two versions (A and B) are compared to see which performs better, often used in product or marketing decisions.
13. Explain feature engineering.
Answer: Feature engineering involves creating new features or modifying existing ones to improve model performance.
14. What is a confusion matrix?
Answer: A confusion matrix is a table that shows the performance of a classification algorithm by displaying true positives, false positives, true negatives, and false negatives.
15. Define precision and recall.
Answer: Precision is the accuracy of positive predictions, while recall is the ability to find all actual positives in the data.
16. What is F1 Score?
Answer: F1 Score is the harmonic mean of precision and recall, used to measure model accuracy when both precision and recall are important.
17. Explain the term ‘entropy’ in data science.
Answer: Entropy is a measure of randomness or disorder in a dataset. In decision trees, it helps decide the best split by selecting the feature with the lowest entropy.
18. What is gradient descent?
Answer: Gradient descent is an optimization algorithm that minimizes the error in machine learning models by adjusting weights iteratively.
19. What is an outlier?
Answer: An outlier is a data point significantly different from other data points, potentially indicating an error or a unique pattern.
20. What is the difference between bagging and boosting?
Answer: Bagging combines models by averaging their predictions to reduce variance, while boosting combines models sequentially to reduce bias and error.
21. Explain k-means clustering.
- Answer: K-means clustering is an unsupervised learning algorithm that groups data into k clusters by minimizing the distance between data points and the cluster centroid.
22. What is the elbow method?
- Answer: The elbow method helps determine the optimal number of clusters in k-means by plotting the sum of squared distances and finding an “elbow.”
23. What is a ROC curve?
- Answer: A ROC curve plots the true positive rate against the false positive rate, helping visualize model performance at various thresholds.
24. Explain Naive Bayes.
- Answer: Naive Bayes is a probabilistic classifier that assumes features are independent and calculates probabilities for each class, selecting the highest probability.
25. What is data normalization?
- Answer: Normalization scales numerical data to fit within a specific range, usually [0, 1], to improve model performance.
26. What is standardization in data preprocessing?
- Answer: Standardization scales data to have a mean of 0 and a standard deviation of 1, making it easier to compare features with different scales.
27. What are principal components?
- Answer: Principal components are new variables in PCA that capture the most variance in data, reducing the number of features while retaining important information.
28. What is a support vector machine (SVM)?
- Answer: SVM is a supervised algorithm that finds a hyperplane to separate classes with the maximum margin.
29. Explain decision trees.
- Answer: Decision trees split data into branches based on feature values, using metrics like Gini impurity or entropy to make predictions.
30. What is ensemble learning?
- Answer: Ensemble learning combines predictions from multiple models to improve overall accuracy and reduce errors.
31. What is a random forest?
- Answer: Random forest is an ensemble method that builds multiple decision trees and combines their results for a more accurate prediction.
32. Explain neural networks.
- Answer: Neural networks are layers of interconnected nodes that process data to recognize patterns, especially useful in image and speech recognition.
33. What is backpropagation?
- Answer: Backpropagation is an algorithm for training neural networks by adjusting weights to minimize error, propagating from output to input layers.
34. What is a learning rate?
- Answer: Learning rate controls how much weights are adjusted in each iteration of training. A low rate makes training slow, while a high rate may overshoot optimal values.
35. What is L1 and L2 regularization?
- Answer: L1 regularization adds an absolute value penalty to the loss function, promoting sparsity. L2 adds a squared penalty, helping prevent overfitting.
36. What is early stopping?
- Answer: Early stopping halts training when a model’s performance on validation data stops improving, preventing overfitting.
37. Explain hyperparameter tuning.
- Answer: Hyperparameter tuning finds the best settings for a model’s hyperparameters, improving accuracy without changing the underlying model.
38. What is a recommender system?
- Answer: A recommender system suggests items or content to users based on their behavior, preferences, or similar users.
39. Explain collaborative filtering.
- Answer: Collaborative filtering recommends items by identifying users with similar preferences or past behaviors.
40. What is content-based filtering?
- Answer: Content-based filtering recommends items similar to those a user has liked, based on item attributes.

41. What is the curse of dimensionality?
- Answer: The curse of dimensionality refers to the problems that arise when dealing with high-dimensional data, like increased computation and risk of overfitting.
42. What is dimensionality reduction?
- Answer: Dimensionality reduction techniques like PCA reduce the number of features while preserving important information in data.
43. What are categorical and numerical variables?
- Answer: Categorical variables represent discrete groups, like gender, while numerical variables represent measurable quantities, like age.
44. Explain dummy variables.
- Answer: Dummy variables are binary (0 or 1) variables created from categorical data, allowing algorithms to interpret these values.
45. What is a hash table in data science?
- Answer: A hash table is a data structure that stores key-value pairs, useful for fast data retrieval.
46. Explain feature selection.
- Answer: Feature selection chooses the most important variables in a dataset, reducing complexity and improving model performance.
47. What is a time series?
- Answer: Time series data is sequential data collected over time, used in forecasting.
48. What is ARIMA in time series analysis?
- Answer: ARIMA is a model for time series data, combining autoregressive and moving average components with differencing to make predictions.
49. Explain hierarchical clustering.
- Answer: Hierarchical clustering groups data points into a hierarchy, starting with individual points and merging them based on similarity.
50. What is cosine similarity?
- Answer: Cosine similarity measures the similarity between two vectors by calculating the cosine of the angle between them, useful in text and recommendation tasks.
51. What is the Central Limit Theorem?
- Answer: The Central Limit Theorem states that the distribution of the sample mean approaches a normal distribution as the sample size increases, regardless of the original data’s distribution.
52. Explain the difference between a histogram and a boxplot.
- Answer: A histogram shows the distribution of a single variable, while a boxplot displays the spread and quartiles of a dataset, highlighting the median and any outliers.
53. What is the difference between mean, median, and mode?
- Answer: Mean is the average, median is the middle value in a sorted list, and mode is the most frequent value.
54. What are quartiles?
- Answer: Quartiles divide data into four equal parts. The first quartile is the 25th percentile, the second is the 50th (median), and the third is the 75th percentile.
55. What is skewness?
- Answer: Skewness measures the asymmetry of data distribution. Positive skew means a tail on the right, while negative skew means a tail on the left.
56. What is kurtosis?
- Answer: Kurtosis measures the ‘tailedness’ of a data distribution. High kurtosis means more outliers, while low kurtosis indicates fewer outliers.
57. Explain the bootstrap sampling method.
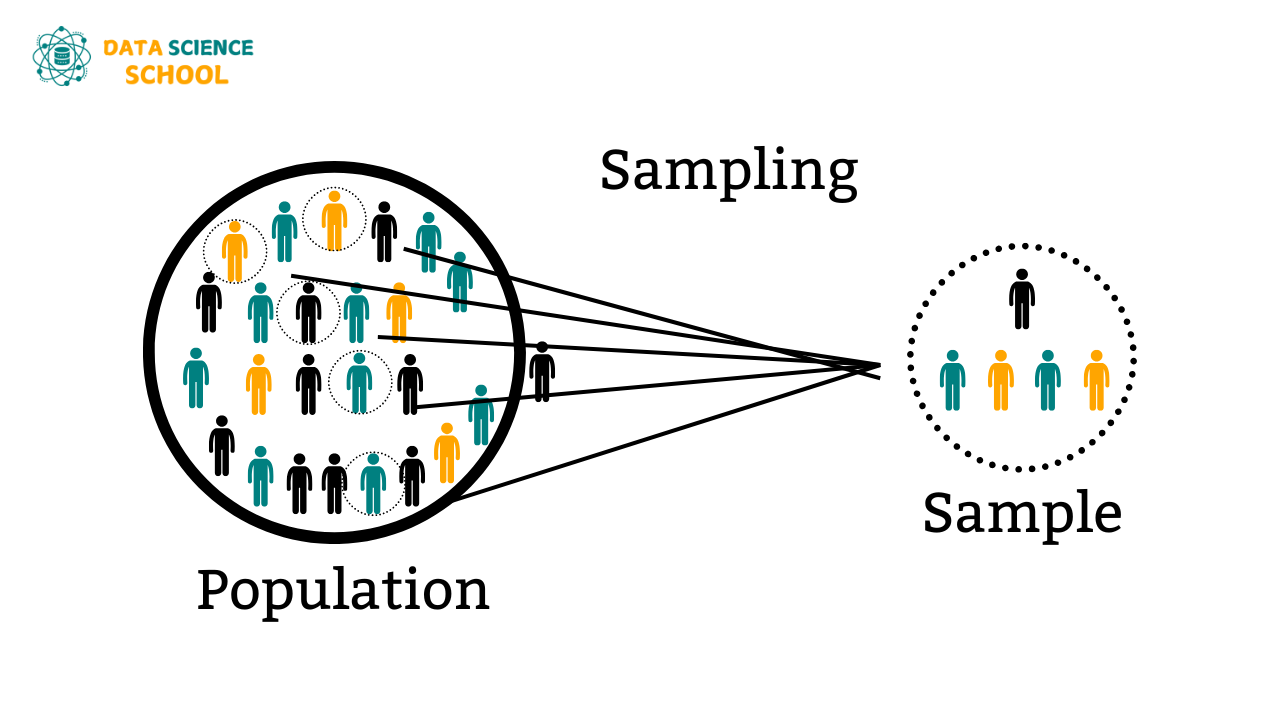
- Answer: Bootstrap sampling is a technique of resampling data with replacement, often used to estimate population parameters and model performance.
58. What is hierarchical clustering?
- Answer: Hierarchical clustering builds a tree of clusters, starting with individual data points and merging them based on similarity until one large cluster remains.
59. What is cross-entropy?
- Answer: Cross-entropy measures the difference between two probability distributions, often used as a loss function in classification tasks.
60. What is correlation?
- Answer: Correlation measures the linear relationship between two variables, with values ranging from -1 (negative) to +1 (positive).

61. What is covariance?
- Answer: Covariance indicates how two variables change together. Positive covariance means they increase together, while negative covariance means they move in opposite directions.
62. What is natural language processing (NLP)?
- Answer: NLP is a field of AI focused on enabling computers to understand and process human languages for tasks like sentiment analysis and language translation.
63. Explain bag-of-words in NLP.
- Answer: Bag-of-words is a text representation method that treats each word as a feature, counting the occurrences of each word in a document.
64. What is TF-IDF?
- Answer: TF-IDF (Term Frequency-Inverse Document Frequency) is a weighting technique that highlights important words in a document based on their frequency and uniqueness.
65. What is stemming and lemmatization in NLP?
- Answer: Stemming reduces words to their base form (e.g., “running” to “run”), while lemmatization uses dictionary forms, preserving meaning more accurately.
66. What is a sliding window in time series analysis?
- Answer: A sliding window processes data in fixed-size intervals, updating the window as new data comes in. It’s often used in moving average and forecasting models.
67. Explain one-hot encoding.
- Answer: One-hot encoding converts categorical data into binary columns, where each category is represented by a unique column with a value of 1 or 0.
68. What is data imputation?
- Answer: Data imputation fills missing values using techniques like mean, median, mode replacement, or advanced methods like k-nearest neighbors.
69. What is model interpretability?
- Answer: Model interpretability explains how a model makes predictions, which is essential for complex models like neural networks and decision trees.
70. Explain random oversampling and undersampling.
- Answer: Random oversampling duplicates minority class samples, while undersampling reduces majority class samples to handle class imbalance in datasets.
71. What is a Markov chain?
- Answer: A Markov chain is a stochastic model that predicts the probability of future states based only on the current state, used in sequence analysis and NLP.
72. What is an embedding in NLP?
- Answer: Embeddings are dense vector representations of words that capture semantic meaning, helping models understand language better.
73. What is feature scaling?
- Answer: Feature scaling adjusts data to fit a particular range, like [0, 1] for normalization or z-scores for standardization, to improve model performance.
74. What is Gradient Boosting?
- Answer: Gradient Boosting is an ensemble method that builds models sequentially, reducing errors by adding weak learners.
75. What is a decision boundary?
- Answer: A decision boundary is a line or curve that separates different classes in a classification model.
76. Explain K-Nearest Neighbors (KNN).
- Answer: KNN is a supervised algorithm that classifies data points based on the majority class of its ‘K’ nearest neighbors.
77. What is an activation function?
- Answer: Activation functions in neural networks determine the output of a neuron, enabling non-linear transformations for complex data patterns.
78. Explain the sigmoid function.
- Answer: The sigmoid function is an activation function that maps values to a range of 0 to 1, commonly used in binary classification problems.
79. What is data leakage?
- Answer: Data leakage occurs when information from outside the training dataset leaks into the model, causing overly optimistic performance.
80. What is a learning curve?
- Answer: A learning curve plots model performance against training iterations, showing how learning improves with more data.

81. What is root mean square error (RMSE)?
- Answer: RMSE measures the average error of a model’s predictions, giving a higher penalty to large errors, often used in regression analysis.
82. What is mean absolute error (MAE)?
- Answer: MAE is the average of absolute differences between predictions and actual values, giving equal weight to all errors.
83. What is feature importance?
- Answer: Feature importance measures how much each feature contributes to a model’s predictions, helping identify significant variables.
84. What is ensemble averaging?
- Answer: Ensemble averaging combines multiple models by averaging their predictions to improve overall accuracy and stability.
85. Explain precision-recall tradeoff.
- Answer: Precision-recall tradeoff shows the balance between precision and recall, often adjusted by setting different thresholds in classification.
86. What is a holdout set?
- Answer: A holdout set is a subset of data used only for final model evaluation after training and validation, giving a realistic performance measure.
87. What is SMOTE?
- Answer: SMOTE (Synthetic Minority Over-sampling Technique) generates synthetic samples for the minority class, helping address class imbalance in data.
88. What is the difference between parametric and non-parametric models?
- Answer: Parametric models assume a specific form for the data distribution, while non-parametric models do not, making them more flexible with complex data.
89. What is ensemble stacking?
- Answer: Stacking combines different models by using their predictions as inputs to a new model, creating a stronger overall model.
90. What is K-fold cross-validation?
- Answer: K-fold cross-validation splits data into ‘K’ subsets, training the model ‘K’ times with each subset as the validation set once, improving reliability.
91. What is a sparse matrix?
- Answer: A sparse matrix is a matrix where most elements are zero, often used in NLP and recommendation systems to save memory.
92. What is Bayesian inference?
- Answer: Bayesian inference uses Bayes’ theorem to update probabilities based on new evidence, widely used in statistics and machine learning.
93. What is data augmentation?
- Answer: Data augmentation creates variations in training data (like flipping, rotating images) to improve model generalization.
94. Explain grid search.
- Answer: Grid search tests different combinations of hyperparameters to find the best configuration for a model.
95. What is the bagging algorithm?
- Answer: Bagging (Bootstrap Aggregating) creates multiple versions of a model on resampled data and combines them to reduce variance and improve accuracy.
96. What is the difference between clustering and classification?
- Answer: Clustering is unsupervised and groups data without labels, while classification is supervised and assigns data to predefined classes.
97. What is anomaly detection?
- Answer: Anomaly detection identifies rare or unusual patterns that do not conform to normal behavior, used in fraud detection and quality control.
98. What is the ‘no free lunch’ theorem?
- Answer: The no free lunch theorem states that no single model works best for all problems; model performance depends on the specific problem and data.
99. What is a recommendation engine?
- Answer: A recommendation engine suggests items to users by analyzing past preferences, using collaborative or content-based filtering.
100. Explain Bayesian Optimization.
- Answer: Bayesian Optimization is a technique to find the best hyperparameters by building a probabilistic model, optimizing the model efficiently.
Want To Learn More About Data Science?
Join our Data Science School to gain in-depth knowledge and hands-on experience in data science. Learn directly from industry experts through real-time projects and interactive sessions.

