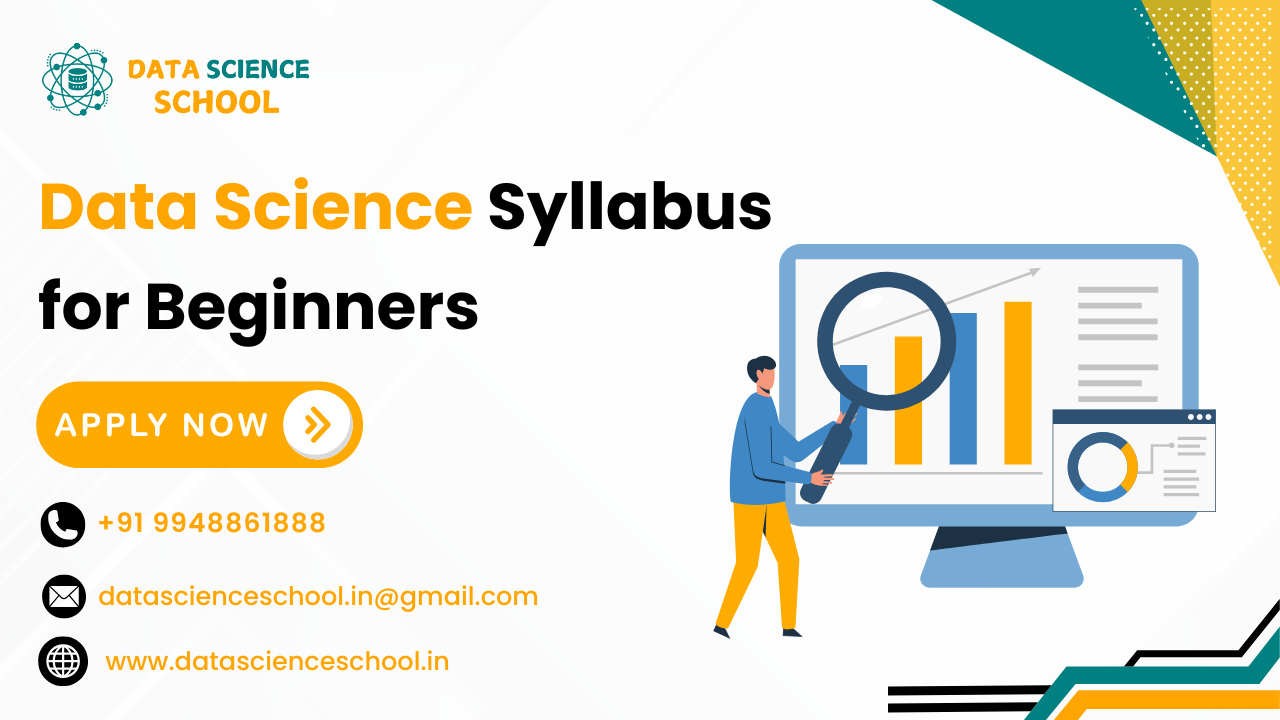
Data Science Syllabus for Beginners
1. Understand what data science is, its applications, and its importance in various industries.
2. Learn basic programming concepts using Python or R, which are commonly used in data science for data manipulation and analysis.
3. Focus on essential mathematics, including statistics, probability, linear algebra, and calculus to understand data modeling.
4. Learn how to gather and preprocess data (removing missing values, handling outliers, etc.) to prepare it for analysis.
5. Explore python libraries like Matplotlib, Seaborn (Python), or ggplot2 (R) for creating insightful visualizations of data.
6. Understand how to analyze and summarize data, detect patterns, and extract useful insights using statistical methods.
7. Study fundamental algorithms like linear regression, logistic regression, decision trees, and k-nearest neighbors.
8. Learn the difference between supervised learning (labeled data) and unsupervised learning (unlabeled data), including clustering and classification.
9. Understand how to evaluate machine learning models using techniques like cross-validation, accuracy, precision, recall, and confusion matrix.
10. Get familiar with data science tools like Jupyter Notebooks, Pandas, NumPy, and Scikit-learn for data manipulation and machine learning.
11. Data science is a multidisciplinary field that combines statistics, programming, and domain expertise to analyze and extract insights from data.
12. It is used in various industries like healthcare, finance, and e-commerce to solve real-world problems, such as predicting customer behavior or improving operational efficiency.
13. For beginners, data science offers a blend of technical and analytical skills that make it an exciting and impactful field to explore.
Importance of Learning Data Science
- In today’s digital world, data is the key to innovation. Organizations rely on data science to make informed decisions, drive growth, and stay competitive. Whether it’s personalizing customer experiences or optimizing supply chains, the demand for skilled data scientists is at an all-time high. Learning data science equips individuals with tools to analyze data effectively, making them valuable assets in the workforce.
Who Can Learn Data Science?
- Anyone can learn data science, regardless of their background. Whether you’re from IT, business, or even arts, the field offers something for everyone. Beginners can start with fundamental skills like programming (Python or R) and statistics, gradually building expertise in tools and techniques used for data analysis and machine learning. With accessible resources and a curiosity-driven mindset, anyone can excel in this field.
Overview of the Data Science Syllabus
A beginner’s data science syllabus typically covers:
- Data Types and Structures: Understanding structured, unstructured, and semi-structured data.
- Programming: Learning Python or R Language for data manipulation and analysis.
- Statistics: Covering key concepts like probability, hypothesis testing, and distributions.
- Machine Learning: Basics of supervised and unsupervised learning.
- Data Visualization: Using tools like Matplotlib, Seaborn, or Tableau for visual insights.
Hands-on projects and real-world applications are integral to learning, helping beginners develop practical skills and build portfolios.
Key Topics in Data Science
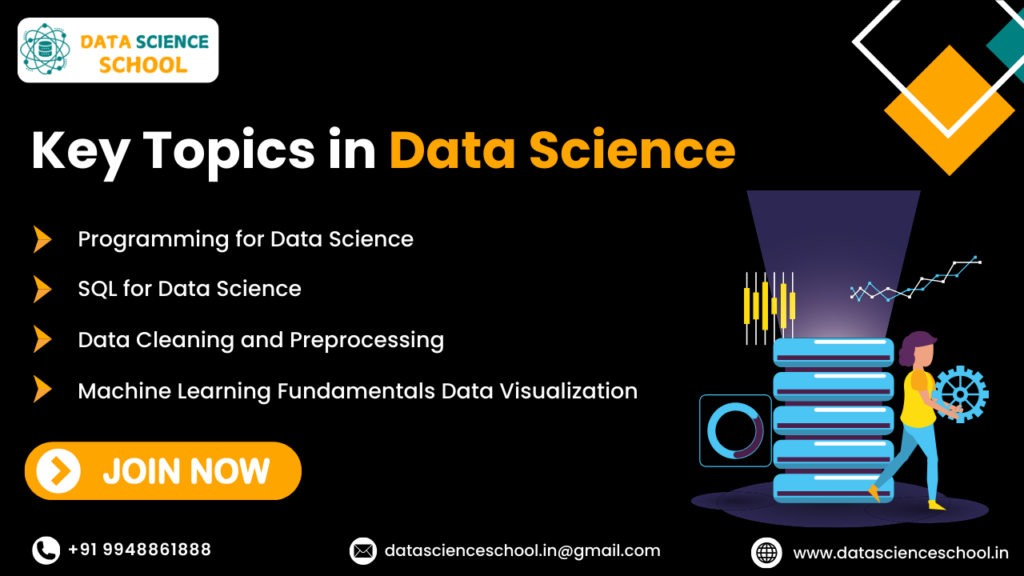
- Programming for Data Science: Python and R are beginner-friendly languages offering libraries like Pandas, NumPy, and Scikit-learn for data processing and machine learning.
- SQL for Data Science: Essential for working with relational databases, querying data, and performing data manipulations.
- Data Cleaning and Preprocessing: Learning to handle missing data, remove duplicates, and structure datasets effectively.
- Machine Learning Fundamentals: Implementing algorithms like regression, classification, and clustering.
- Data Visualization: Creating impactful charts and dashboards using Tableau, Power BI, or Python libraries.
Career Prospects and Skills Development
With the growing reliance on data-driven decisions, careers in data science are abundant. Roles like data analyst, machine learning engineer, and AI specialist are in high demand. Learning data science also sharpens problem-solving, critical thinking, and communication skills, making it a holistic and rewarding career choice.
What is Data Science?
- Data science is the interdisciplinary field that combines statistical methods, computer science, and domain expertise to extract meaningful insights from data. At its essence, data science transforms raw, unstructured data into actionable intelligence, enabling organizations to make informed decisions. It’s not just limited to crunching numbers or writing algorithms; it’s about solving real-world problems by asking the right questions and leveraging the power of data to answer them.
- For instance, consider how Netflix recommends movies or Amazon suggests products. Behind the scenes, data scientists analyze user behavior, preferences, and patterns to make these systems intelligent and personalized. Data science also plays a vital role in industries like healthcare, finance, retail, and transportation, where data-driven decisions can significantly impact efficiency, profitability, and innovation.
- For beginners, understanding the scope of data science can be overwhelming, given its vast applications. However, breaking it down into manageable parts—such as learning the basics of programming, data handling, and statistical analysis—can make it accessible. Data science is more than a technical skill; it’s a mindset of curiosity and problem-solving, where every dataset holds a story waiting to be uncovered.
Importance of Learning Data Science in Today’s World
- Data has become the lifeblood of the digital age. In a world driven by information, data science has emerged as a critical skill set for unlocking the potential of massive datasets. Every click on a website, every swipe on a smartphone, and every transaction generates data. Organizations use this data to understand consumer behavior, predict trends, optimize operations, and improve services.
- Consider this: according to recent studies, the global data science market is projected to reach billions in revenue in the next few years, fueled by an increasing demand for data-driven solutions. From multinational corporations to small startups, data science is transforming how businesses operate. Even beyond the corporate world, data science has profound implications for societal challenges. For instance, it is being used to combat climate change by analyzing weather patterns, predict disease outbreaks, and optimize vaccine distribution.
- For beginners, learning data science opens doors to a plethora of opportunities across various sectors. The demand for data science professionals has skyrocketed, with roles such as data analysts, machine learning engineers, and AI specialists among the most sought-after. Moreover, the field is ever-evolving, offering continuous learning opportunities and a chance to contribute to meaningful projects. By acquiring data science skills, you don’t just join an industry—you become part of a movement shaping the future.
Who Can Learn Data Science?
- One of the most appealing aspects of data science is its accessibility to learners from diverse backgrounds. Whether you’re a seasoned IT professional, a recent graduate, or someone from a completely unrelated field, you can embark on a data science journey with the right mindset and resources.
- For those with a technical background, such as engineering, computer science, or mathematics, transitioning into data science may feel like a natural progression. However, people from non-technical fields, including business, healthcare, social sciences, and even arts, are finding their place in this dynamic field. The common denominator is curiosity—the ability to ask questions and the determination to find answers using data.
- The tools and technologies available today make data science more accessible than ever. Online platforms like Coursera, DataCamp, and Udemy offer beginner-friendly courses, while tools like Python and R are user-friendly and widely adopted in the field. Additionally, resources like Kaggle and GitHub provide opportunities for practical learning and collaboration.
- What’s more, the interdisciplinary nature of data science means that your existing knowledge and experience can complement your learning. For instance, a marketing professional learning data science could specialize in analyzing consumer trends, while someone from healthcare could focus on patient data analytics. Regardless of your starting point, the only prerequisites are a willingness to learn and a commitment to practice.
Overview of the Data Science Syllabus
- A well-rounded Data Science Syllabus serves as a roadmap for mastering this exciting field. For beginners, the syllabus typically starts with foundational concepts, such as understanding data types and structures. You’ll learn how to work with different formats like CSV files, JSON data, and SQL databases. This knowledge sets the stage for more advanced topics like data cleaning and exploratory data analysis.
- Next, programming is introduced—usually Python or R, as they are the most popular languages for data science. Python’s extensive libraries, such as Pandas for data manipulation, NumPy for numerical computations, and Matplotlib for visualization, make it an ideal choice for beginners. Alongside programming, you’ll dive into statistics and probability, which form the backbone of data science. These concepts are essential for understanding machine learning algorithms and interpreting data.
- As you progress, the syllabus covers data visualization, machine learning, and model evaluation. Tools like Seaborn, Tableau, and Power BI are explored to create compelling visuals that make your insights clear and impactful. Machine learning is another key focus, where you’ll learn to build predictive models using techniques like linear regression, decision trees, and clustering algorithms.
- Finally, a good syllabus emphasizes hands-on projects. You’ll work on real-world datasets, applying the skills you’ve learned to solve practical problems. This project-based approach not only solidifies your knowledge but also helps you build a portfolio to showcase your abilities to potential employers.
- Before diving into analysis, it’s crucial to understand the various types and structures of data. Data comes in three main forms: structured, unstructured, and semi-structured. Structured data is organized and easily searchable, like rows in a spreadsheet or a database table. Examples include sales records or customer information.
- Unstructured data, on the other hand, lacks a predefined format. Think of social media posts, videos, or emails. This type of data requires specialized tools and techniques to process and analyze. Semi-structured data sits somewhere in between. Formats like JSON or XML have an underlying structure but aren’t as rigid as a relational database.
- Understanding these data types helps you determine how to handle and process them effectively. Beginners should also familiarize themselves with data structures like arrays, lists, and dictionaries in programming. These structures are crucial for organizing and manipulating data in Python or R.
- Moreover, knowing the sources of data—whether it’s web scraping, APIs, or manual collection—gives you a head start in any project. By grasping the basics of data types and structures, you’ll be better equipped to manage and analyze data, setting the foundation for your journey in data science.
Introduction to Programming for Data Science
- Programming is the foundation of data science, and for beginners, it often serves as the gateway to understanding how data is manipulated and analyzed. Python and R are the two most popular programming languages in this field, each with its own strengths. Python is favored for its simplicity and versatility, making it a go-to language for those new to coding. R, on the other hand, is a powerful language for statistical analysis and visualization, making it ideal for research-focused tasks.
- When starting, beginners learn the basics of programming: variables, loops, conditionals, and functions. These fundamentals lay the groundwork for more advanced concepts like data manipulation and algorithm implementation. A significant aspect of programming for data science is understanding how to work with data structures, such as arrays, lists, dictionaries, and data frames. Python’s libraries, such as NumPy and Pandas, simplify these tasks, enabling you to perform complex operations with just a few lines of code.
- The hands-on nature of programming makes it an exciting and rewarding skill to learn. You’ll write scripts to automate repetitive tasks, clean messy datasets, and even build your first machine learning models. As you progress, the ability to integrate programming skills with data analysis techniques becomes invaluable, empowering you to tackle increasingly complex challenges in the data science realm.
Mathematics for Data Science
- Mathematics is the bedrock upon which data science is built. Without a grasp of mathematical concepts, understanding the inner workings of data science models and algorithms becomes challenging. However, the good news is that you don’t need an advanced degree in math to get started. A strong foundation in linear algebra, probability, and statistics is sufficient for most data science tasks.
- Linear algebra is vital for understanding data representations like matrices and vectors, which are used extensively in machine learning algorithms. For example, concepts like matrix multiplication are essential for neural networks and dimensionality reduction techniques. Probability and statistics, on the other hand, are at the core of data analysis. They help you measure uncertainty, analyze trends, and make predictions based on data. Concepts like mean, variance, distributions, and hypothesis testing are used in everything from exploratory data analysis to machine learning model evaluation.
- Additionally, basic calculus plays a role in optimization problems, such as finding the minimum error in a predictive model. While it may seem intimidating at first, tools like Python’s SymPy library and visualization techniques can simplify these mathematical processes. Beginners should start with a step-by-step approach, practicing problems and understanding how each concept ties into real-world data science tasks.
Introduction to Jupyter Notebook and IDEs
- Jupyter Notebook is a game-changer for anyone starting their data science journey. It’s an interactive computing environment that allows you to write and execute code, visualize data, and document your process—all in one place. This makes it an ideal tool list for beginners, as you can experiment with code snippets, view results instantly, and annotate your workflow for better understanding.
- A typical Jupyter Notebook interface is divided into cells. You can write Python code in one cell and add explanations in Markdown in another. This makes it perfect for creating self-contained projects that combine analysis, visualization, and documentation. Additionally, Jupyter supports libraries like Pandas, NumPy, and Matplotlib, enabling you to perform data manipulation and visualization seamlessly.
- Apart from Jupyter Notebook, Integrated Development Environments (IDEs) like PyCharm, Visual Studio Code, and RStudio offer robust coding environments. These tools come with features like syntax highlighting, debugging, and version control integration, which enhance productivity and efficiency. Beginners should start with Jupyter Notebook to gain confidence in coding and transition to IDEs as they take on larger, more complex projects.
Version Control Systems (Git and GitHub Basics)
- Version control systems are essential tools for managing your data science projects, especially as they grow in complexity. Git is the most widely used version control tool, and GitHub is its cloud-based counterpart, allowing you to collaborate with others and showcase your work.
- Git tracks changes to your files, enabling you to revert to previous versions if something goes wrong. Commands like git init, git add, and git commit are the building blocks for managing your project history. GitHub takes this functionality further by providing a platform to store and share your repositories. You can collaborate with teammates on the same project, contribute to open-source initiatives, or create a portfolio to display your skills to potential employers.
- For beginners, learning Git and GitHub might seem daunting, but it becomes easier with practice. Start by creating a simple repository, committing changes, and exploring features like branches and pull requests. By mastering version control early, you’ll not only enhance your workflow but also build a habit of maintaining clean, organized projects—an invaluable skill in the data science field.
Popular Libraries for Data Science
- Libraries are the backbone of data science programming, providing pre-written functions and tools to streamline your work. Python boasts a rich ecosystem of libraries tailored for data manipulation, visualization, and machine learning, making it a favorite among data scientists.
- NumPy is a fundamental library for numerical computing, offering support for arrays, matrices, and mathematical functions. Pandas is indispensable for data manipulation, allowing you to clean, filter, and analyze data with ease. Matplotlib and Seaborn are your go-to libraries for creating visualizations, whether it’s a simple line graph or an intricate heatmap.
- For machine learning, Scikit-learn is an excellent starting point. It provides tools for implementing regression, classification, and clustering algorithms, along with model evaluation metrics. For deep learning enthusiasts, TensorFlow and PyTorch offer powerful frameworks for building and training neural networks.
- Beginners should start by mastering NumPy and Pandas, as they form the foundation for most data science workflows. Once comfortable, explore visualization libraries and gradually move into machine learning frameworks. By leveraging these libraries, you can focus on solving problems rather than reinventing the wheel, making your work more efficient and impactful.
Introduction to SQL for Data Science
- SQL (Structured Query Language) is a cornerstone of data science, as it enables you to interact with and manage data stored in relational databases. Regardless of the industry, most real-world data resides in databases, and SQL is the tool used to retrieve, manipulate, and analyze this data effectively. For instance, companies store customer, sales, and transaction data in relational databases like MySQL, PostgreSQL, or Microsoft SQL Server, making SQL a must-have skill for data scientists.
- As a beginner, you’ll start by learning basic SQL commands such as SELECT (to retrieve data), INSERT (to add new data), UPDATE (to modify existing data), and DELETE (to remove unwanted data). These commands help you perform essential operations on databases. Next, you’ll progress to more advanced concepts like joins, which allow you to combine data from multiple tables, and subqueries, which are used to perform nested operations. Learning indexing techniques and optimizing queries can further enhance your efficiency when working with large datasets.
- SQL’s power lies in its ability to handle structured data efficiently. For example, a simple query can help you identify the most purchased product in a store or calculate monthly sales growth. Beginners can practice SQL on platforms like SQLZoo or Kaggle and gradually work on larger, real-world datasets. Mastering SQL ensures you have the skills to handle data at its source, making it an indispensable part of your data science toolkit.
Data Collection Methods
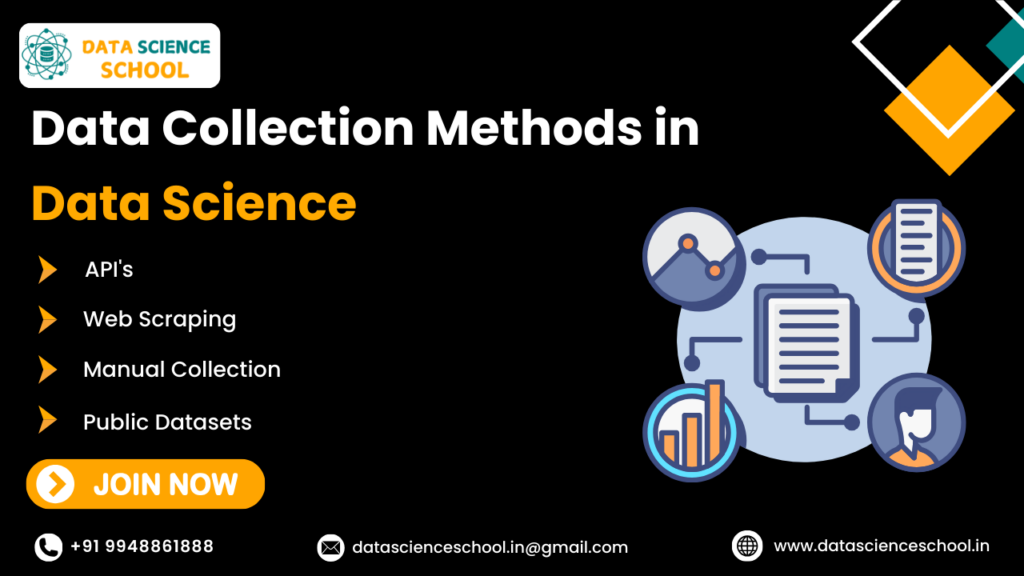
Data collection is the first step in any data science project, as the quality of your analysis depends on the data you gather. There are several methods to collect data, and understanding these techniques is crucial for ensuring your datasets are reliable, relevant, and complete.
1. APIs:
Application Programming Interfaces (APIs) are a popular method for programmatically accessing structured data from websites and services. For example, you can use Twitter’s API to collect tweets based on hashtags or Google Maps API for location data. Tools like Python’s requests library make it easy to interact with APIs, fetch data, and integrate it into your analysis.
2. Web Scraping:
When data isn’t readily available through APIs, web scraping is another effective method. Using tools like BeautifulSoup or Scrapy in Python, you can extract data directly from web pages. This is particularly useful for gathering information like product prices, reviews, or job listings.
3. Manual Collection:
For small-scale projects, manual data collection—such as surveys, questionnaires, or compiling data from public records—can be a practical approach. While time-consuming, this method gives you full control over the data’s accuracy and structure.
4. Public Datasets:
Many organizations and governments provide open datasets for free. Websites like Kaggle, UCI Machine Learning Repository, and Data.gov are excellent starting points for beginners to find datasets across various domains.
Each method has its challenges, such as ensuring data quality, handling missing values, or dealing with ethical concerns like privacy. For beginners, practicing with public datasets and experimenting with APIs or web scraping can provide valuable hands-on experience, helping you build confidence in your data collection abilities.
Data Cleaning and Wrangling
Data cleaning and wrangling are essential steps in preparing raw data for analysis. In the real world, data is often messy—full of inconsistencies, errors, and missing values. Without proper cleaning, your analysis can lead to inaccurate or misleading results. Data wrangling, on the other hand, involves transforming data into a format suitable for analysis, such as restructuring or aggregating data.
Common Data Cleaning Tasks:
- Handling Missing Values: Missing data is a common issue. Techniques include filling gaps with mean or median values, forward or backward filling, or removing incomplete records entirely.
- Dealing with Outliers: Outliers, or extreme values, can skew your analysis. Identifying and addressing them—through statistical methods or visual inspection—helps ensure robust results.
- Removing Duplicates: Duplicate entries can inflate dataset size and lead to skewed analysis. Using tools like Python’s Pandas library, you can identify and drop duplicates easily.
- Standardizing Data: Ensuring consistency in formats (e.g., date formats, currency symbols) is critical, especially when combining multiple datasets.
Data Wrangling Techniques:
- Reshaping Data: Converting wide data to long format or vice versa depending on the analysis requirements.
- Feature Engineering: Creating new variables or modifying existing ones to improve analysis or model performance.
- Filtering and Subsetting: Extracting relevant portions of data for targeted analysis.
For beginners, tools like Pandas in Python simplify these processes. Functions like fillna(), drop_duplicates(), and groupby() are indispensable for cleaning and wrangling data. Practice is key—start with small datasets and gradually work your way to more complex ones. Remember, clean data is the foundation of meaningful analysis, and mastering these skills is a critical step in your data science journey.
Exploratory Data Analysis (EDA)
Exploratory Data Analysis (EDA) is the process of examining and summarizing data to uncover patterns, relationships, and anomalies. It’s a critical step in understanding your dataset and preparing for further analysis or modeling. Think of EDA as detective work—you’re exploring the data to answer questions and identify insights.
Steps in EDA:
- Summary Statistics: Begin by calculating measures like mean, median, mode, standard deviation, and variance to understand the central tendency and spread of the data. These metrics provide a quick overview of the dataset.
- Data Distributions: Visualizing distributions helps identify patterns. Histograms and box plots are useful for spotting skewness, outliers, or multimodal distributions.
- Relationships Between Variables: Scatter plots, correlation matrices, and pair plots help reveal relationships between variables, such as positive or negative correlations.
- Handling Missing Data: During EDA, missing values can be identified and addressed, either through imputation or removal.
Visualization in EDA:
- Visualizations are a cornerstone of EDA, making it easier to interpret and communicate findings. Libraries like Matplotlib and Seaborn in Python allow you to create bar charts, line plots, heatmaps, and more. For example, a heatmap can highlight correlations between variables, while a scatter plot can show trends or clusters.
- EDA is not just about generating numbers or charts—it’s about interpreting them to gain actionable insights. Beginners should start with small datasets and focus on answering specific questions. As you gain experience, you’ll develop an intuition for spotting patterns and anomalies, making EDA a powerful tool in your data science arsenal.
Importance of Data Visualization in Data Science
- Data visualization is more than just making charts—it’s about communicating complex insights in a way that’s easy to understand. The human brain processes visual information faster than text or numbers, which makes visualization a crucial aspect of data science. Whether you’re presenting findings to a non-technical audience or exploring data for analysis, effective visualizations help you convey your message clearly.
- Good visualizations highlight key insights without overwhelming the viewer. For example, a simple bar chart can show sales growth over time, while a line chart can depict trends. More advanced visualizations, like interactive dashboards created with Tableau or Power BI, allow users to explore data dynamically.
- As a beginner, focus on mastering basic visualization tools like Matplotlib and Seaborn in Python. Learn how to create pie charts, histograms, and scatter plots. Once comfortable, move on to advanced tools like Plotly for interactive visualizations or Tableau for professional-grade dashboards. With practice, you’ll find that data visualization is not just a technical skill but also an art form that makes your data come alive.
Storytelling with Data
- Storytelling with data is an essential skill that transforms raw numbers into compelling narratives. In the field of data science, storytelling bridges the gap between analysis and action. It’s not just about presenting findings; it’s about weaving a story that resonates with your audience, making complex insights easier to understand and more actionable.
- For instance, imagine you’ve analyzed customer feedback and found that product quality is the most significant driver of satisfaction. Instead of simply presenting this as a statistic, storytelling allows you to highlight specific customer testimonials, visualize trends over time, and demonstrate how addressing this issue could boost revenue or brand loyalty. A well-crafted story connects emotionally with stakeholders, ensuring that your insights lead to meaningful change.
Key Elements of Data Storytelling:
- Clarity: Your narrative should focus on the most important insights. Avoid overwhelming your audience with unnecessary details.
- Structure: A strong story has a clear beginning, middle, and end. Start with the problem, introduce the analysis, and conclude with actionable recommendations.
- Visuals: Use charts, graphs, and infographics to support your narrative. Visuals should complement the story, not overshadow it.
Beginner-friendly tools like Tableau, Power BI, and Google Data Studio make it easier to create dashboards and visuals that align with your story. Practice presenting data as stories in small projects or group settings, as this skill will become invaluable when working in professional environments. In data science, the ability to tell a compelling story with data is what separates good analysts from great ones.
Introduction to Descriptive Statistics
Descriptive statistics is the foundation of data analysis, summarizing and organizing raw data into a meaningful format. It helps you understand the central tendencies, variability, and overall structure of your data, providing a clear snapshot before delving into deeper analysis
Core Concepts in Descriptive Statistics:
Inferential statistics goes beyond summarizing data—it enables you to draw conclusions and make predictions about a population based on a sample. One of the most critical components of inferential statistics is hypothesis testing, which helps you validate assumptions and make data-driven decisions.
The Hypothesis Testing Process:
- Formulating Hypotheses: The null hypothesis (H₀) assumes no significant effect or relationship, while the alternative hypothesis (H₁) suggests a significant effect. For instance, you might test whether a new marketing strategy increases sales.
- Selecting a Test: Depending on the data and context, you can use statistical tests like t-tests (for comparing means), chi-square tests (for categorical data), or ANOVA (for comparing multiple groups).
- Setting a Significance Level: The p-value helps determine whether to reject the null hypothesis. A p-value below 0.05 typically indicates statistical significance.
- Drawing Conclusions: Based on the results, you decide whether to accept or reject the null hypothesis.
For example, a company testing a new product feature might find that it significantly improves user engagement, as evidenced by hypothesis testing. Beginners can use tools like Python’s scipy.stats library or statistical software like SPSS to conduct hypothesis tests on sample data. Understanding inferential statistics is crucial for making confident predictions and recommendations, especially when working with incomplete or sampled datasets.
Career Paths and Certifications in Data Science
What Makes Data Science a Lucrative Career?
Data science has emerged as one of the most promising and high-demand career paths in the digital age. The rapid growth of data-driven decision-making across industries has fueled the need for skilled professionals who can analyze and interpret vast amounts of data. What makes this career especially lucrative is its versatility—data scientists are required in almost every sector, from healthcare and finance to retail and entertainment.
In addition to demand, data science roles often come with competitive salaries. According to industry reports, data scientists rank among the highest-paid professionals, with entry-level roles often starting well above the average salary in many countries. The field also offers immense job satisfaction, as data scientists tackle exciting challenges like building AI systems, predicting consumer behavior, or optimizing business strategies.
Moreover, the dynamic nature of data science ensures continuous learning and growth. Technologies evolve rapidly, so professionals in this field are always on the cutting edge of innovation. For individuals passionate about problem-solving and technology, data science offers an unparalleled opportunity to impact industries and organizations globally.
Key Skills Needed for Data Science Roles
Success in data science requires a blend of technical, analytical, and soft skills. At the core are programming skills, particularly in Python and R, which are used for data manipulation and machine learning. Proficiency in SQL is also critical for querying databases. Beyond coding, a strong foundation in mathematics, including statistics, probability, and linear algebra, is essential for understanding and developing algorithms.
Equally important are analytical skills. A data scientist must be able to extract meaningful insights from complex datasets and communicate them effectively. This requires proficiency in data visualization tools like Tableau, Power BI, or Matplotlib, which help transform raw data into actionable visuals.
Soft skills like problem-solving, communication, and teamwork are often overlooked but vital. Data scientists frequently collaborate with cross-functional teams and need to explain technical findings to non-technical stakeholders. For beginners, focusing on a mix of technical and interpersonal skills can lay a strong foundation for a successful career.
The Importance of Certifications in Data Science
Certifications play a critical role in helping aspiring data scientists stand out in a competitive job market. They demonstrate a candidate’s commitment to learning and their proficiency in specific tools, technologies, and methodologies. For employers, certifications act as a benchmark, providing assurance that a candidate has the necessary skills to perform the job.
For beginners, certifications offer a structured learning path and an opportunity to gain hands-on experience with real-world datasets. Programs like IBM’s Data Science Professional Certificate or Google’s Data Analytics Certificate are widely recognized and cover foundational concepts such as Python, SQL, and data visualization.
Experienced professionals can pursue advanced certifications to specialize in areas like machine learning, artificial intelligence, or big data. These credentials help professionals stay relevant and gain expertise in niche fields. Ultimately, certifications are not just resume boosters—they’re a way to gain practical skills and stay competitive in the fast-evolving world of data science.
Data Scientist: The All-Rounder in Data Science
The role of a data scientist is often described as the “all-rounder” in data science because it encompasses a broad range of responsibilities. Data scientists work at the intersection of programming, analytics, and domain knowledge to solve complex problems. They are responsible for everything from cleaning and organizing data to building predictive models and presenting insights to decision-makers.
For example, a data scientist at an e-commerce company might analyze user behavior to optimize product recommendations, while one in healthcare could develop algorithms to predict patient outcomes. This versatility makes data scientists indispensable across industries.
The skill set required includes proficiency in Python, R, SQL, and data visualization tools, along with a strong understanding of machine learning algorithms. Beginners aiming for this role should focus on building a portfolio of projects that showcase their ability to handle real-world datasets. Certifications like the IBM Data Science Professional Certificate can provide a solid foundation for aspiring data scientists.
Data Analyst: Turning Raw Data into Insights
Data analysts play a critical role in transforming raw data into actionable insights that guide business decisions. Unlike data scientists, who often focus on advanced modeling and predictive analytics, data analysts concentrate on descriptive analytics—explaining what happened and why.
Common tasks for a data analyst include creating reports, building dashboards, and conducting exploratory data analysis (EDA) to identify trends and anomalies. For example, a data analyst in a retail company might analyze sales data to understand seasonal trends or identify the best-performing products.
Key skills for this role include Excel, SQL, and data visualization tools like Tableau or Power BI. A foundational understanding of statistics and the ability to communicate findings clearly are also essential. Certifications like Google’s Data Analytics Professional Certificate are excellent starting points for beginners, as they cover the essential tools and concepts needed to thrive in this role.
Machine Learning Engineer: Building Intelligent Systems
Machine learning engineers are at the forefront of artificial intelligence, designing and deploying models that allow systems to learn and adapt without explicit programming. They focus on creating scalable and efficient algorithms that can process large datasets and make predictions or decisions.
This role requires expertise in machine learning frameworks like TensorFlow or PyTorch, as well as a deep understanding of algorithms, neural networks, and optimization techniques. Machine learning engineers often work closely with data scientists to transition models from research to production environments.
For example, a machine learning engineer might develop a recommendation engine for a streaming platform or create an image recognition system for autonomous vehicles. Certifications like the AWS Certified Machine Learning – Specialty or TensorFlow Developer Certificate are valuable for building expertise in this field.
Business Intelligence Analyst: Connecting Data to Strategy
Business intelligence (BI) analysts bridge the gap between data and business strategy. They analyze data to provide actionable insights that drive strategic decisions. Unlike data scientists or analysts, BI analysts focus on creating visual dashboards and reports that provide a high-level overview of performance metrics.
Tools like Tableau, Power BI, and Qlik are essential for BI analysts, as they allow users to create interactive dashboards that stakeholders can easily interpret. For instance, a BI analyst might create a dashboard showing key performance indicators (KPIs) like revenue growth, customer retention, or sales by region.
Certifications like Tableau Desktop Specialist or Microsoft Power BI Data Analyst Associate are excellent for aspiring BI analysts. These credentials demonstrate proficiency in creating visuals that make data accessible and actionable, a skill highly valued in corporate environments.
AI Specialist: Driving the Future with Artificial Intelligence
AI specialists focus on creating intelligent systems that mimic human behavior, such as natural language processing, computer vision, and robotics. They are at the cutting edge of technology, working on tasks like designing chatbots, developing self-driving car algorithms, or building systems capable of understanding human speech.
This role requires a strong foundation in machine learning, deep learning, and programming. Familiarity with AI frameworks like TensorFlow, Keras, or PyTorch is essential. AI specialists also need expertise in natural language processing tools (e.g., NLTK, spaCy) and computer vision libraries (e.g., OpenCV, YOLO).
For example, an AI specialist at a healthcare company might create algorithms to detect diseases in medical images, while one in e-commerce could design a recommendation engine that predicts user preferences. Certifications like the TensorFlow Developer Certificate and Google’s Machine Learning Engineer program provide valuable credentials for aspiring AI specialists. These certifications not only validate your skills but also demonstrate your expertise in an industry rapidly shaping the future.
Statistical Analyst: Focus on Statistical Modeling and Predictions
Statistical analysts play a vital role in data science by using statistical methods to analyze data and identify patterns. Their primary goal is to uncover trends, make predictions, and provide data-driven recommendations. This role is particularly suited to individuals with a strong mathematical background and an interest in applying statistical theory to real-world problems.
Key tasks for a statistical analyst include hypothesis testing, regression analysis, and designing experiments. For instance, in the marketing industry, a statistical analyst might evaluate the effectiveness of advertising campaigns by analyzing click-through rates and conversion rates.
Tools like R and Python, along with statistical software such as SAS or SPSS, are essential for this role. Certifications such as SAS Certified Statistical Business Analyst or Google’s Data Analytics Professional Certificate can help beginners gain the required skills. With statistical analysis forming the backbone of many data science tasks, this career path is ideal for those who enjoy working with numbers and deriving actionable insights from data.
Big Data Specialist: Handling Massive Datasets
Big data specialists are experts in managing, processing, and analyzing massive datasets that traditional systems cannot handle. As industries generate increasing volumes of data, professionals skilled in big data technologies are becoming indispensable. This role focuses on creating systems that can efficiently process and store data while extracting valuable insights.
Key technologies for big data specialists include Hadoop, Spark, and Kafka. These tools enable distributed computing, allowing large datasets to be processed across multiple machines. Additionally, cloud platforms like AWS, Azure, or Google Cloud are widely used to handle big data workloads.
For example, a big data specialist in the retail sector might analyze customer behavior across millions of transactions to optimize inventory and improve customer satisfaction. Certifications like the Cloudera Certified Data Analyst or Google Cloud Certified Professional Data Engineer validate expertise in this domain. For individuals passionate about scaling data solutions, this role offers a unique blend of challenges and opportunities.
Data Architect: Designing and Managing Data Frameworks
Data architects are responsible for designing the architecture of an organization’s data systems. They focus on creating robust frameworks that ensure data is collected, stored, and accessed efficiently. This role involves working closely with data engineers and analysts to ensure the infrastructure meets business needs.
Key responsibilities include designing databases, integrating data sources, and implementing data governance policies. A data architect might also evaluate and recommend tools or technologies to improve system performance. For instance, in a financial institution, a data architect might design a data warehouse to consolidate and streamline reporting processes.
Technical expertise in SQL, NoSQL, and cloud platforms is essential, along with experience in ETL processes and data modeling. Certifications like the AWS Certified Solutions Architect or Google Cloud Professional Data Engineer are highly regarded in this field. Aspiring data architects should focus on building expertise in both technical and strategic aspects of data management.
Google Data Analytics Professional Certificate
The Google Data Analytics Professional Certificate is an excellent starting point for anyone new to data science or analytics. This beginner-friendly program focuses on foundational skills, such as data cleaning, visualization, and analysis, using tools like Excel, SQL, and Tableau. It also emphasizes practical, hands-on experience with real-world datasets, ensuring learners gain applicable skills.
The program includes modules on preparing data, analyzing it, and creating dashboards to communicate insights effectively. It’s ideal for those pursuing roles like data analysts or business intelligence analysts. Upon completion, learners receive an industry-recognized certification, boosting their credibility in the job market.
IBM Data Science Professional Certificate
IBM’s Data Science Professional Certificate is a comprehensive program designed for aspiring data scientists. It covers essential topics like Python programming, data analysis, and machine learning, while introducing tools such as Jupyter Notebook, Pandas, and Scikit-learn.
The program is project-based, ensuring learners build a portfolio that demonstrates their skills to potential employers. Whether you’re a beginner or looking to switch careers, this certification offers a solid foundation in data science concepts and practical applications.
Microsoft Azure Data Scientist Associate
This certification is tailored for professionals working with Microsoft’s Azure cloud platform. It validates expertise in machine learning, data preprocessing, and deploying predictive models in Azure environments. Learners gain hands-on experience with Azure Machine Learning and other cloud-based tools, making it ideal for those pursuing roles as cloud data scientists or machine learning engineers.
AWS Certified Machine Learning – Specialty
This advanced certification focuses on designing, building, and deploying machine learning models using AWS services. It covers everything from data collection and cleaning to model training and optimization. With AWS widely adopted across industries, this certification is highly valued by employers and is ideal for experienced data professionals aiming to specialize in cloud-based machine learning.
How Certifications Impact Career Growth in Data Science
Certifications provide a clear advantage in the competitive field of data science. They validate technical skills, showcase expertise in specific tools or technologies, and increase employability. For entry-level professionals, certifications can open doors to internships or junior roles, while experienced individuals can use them to specialize or advance to leadership positions. Investing in the right certifications ensures you stay ahead in this dynamic field.
Building a Data Science Portfolio with Projects
A strong portfolio is crucial for showcasing your skills and differentiating yourself in the job market. Include projects that highlight your ability to clean data, analyze it, and present insights effectively. Focus on real-world datasets and challenges to demonstrate problem-solving skills. Platforms like Kaggle or GitHub are excellent for hosting and sharing your work, making it accessible to potential employers.
Conclusion
Data science offers a wealth of career opportunities, each with its unique focus and challenges. Certifications play a pivotal role in helping professionals acquire relevant skills and stand out in the job market. Whether you’re a beginner or looking to advance, choosing the right path and investing in your education ensures a rewarding career in this ever-evolving field.
Data Science Syllabus for Beginners: FAQs
1. Can someone without a coding background learn data science?
Absolutely. Beginners can start with simple tools and languages like Python, which is beginner-friendly and widely used.
2. What’s the best way to practice data science?
Work on projects, participate in Kaggle competitions, and experiment with datasets available online.
3.How long does it take to learn data science?
On average, 6-12 months of consistent effort can help beginners grasp the basics, though mastery takes longer.
4. Is math mandatory for data science?
Yes, but only foundational concepts like linear algebra, probability, and statistics are needed for most tasks.
5. Where can I find free datasets?
Platforms like Kaggle, UCI Machine Learning Repository, and Data.gov offer free datasets across various domains.